Monitoring
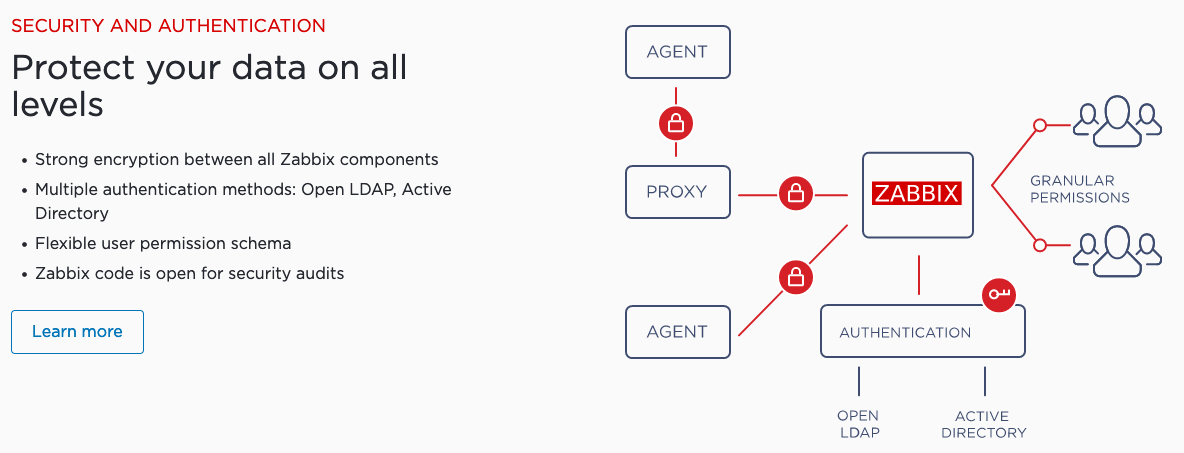
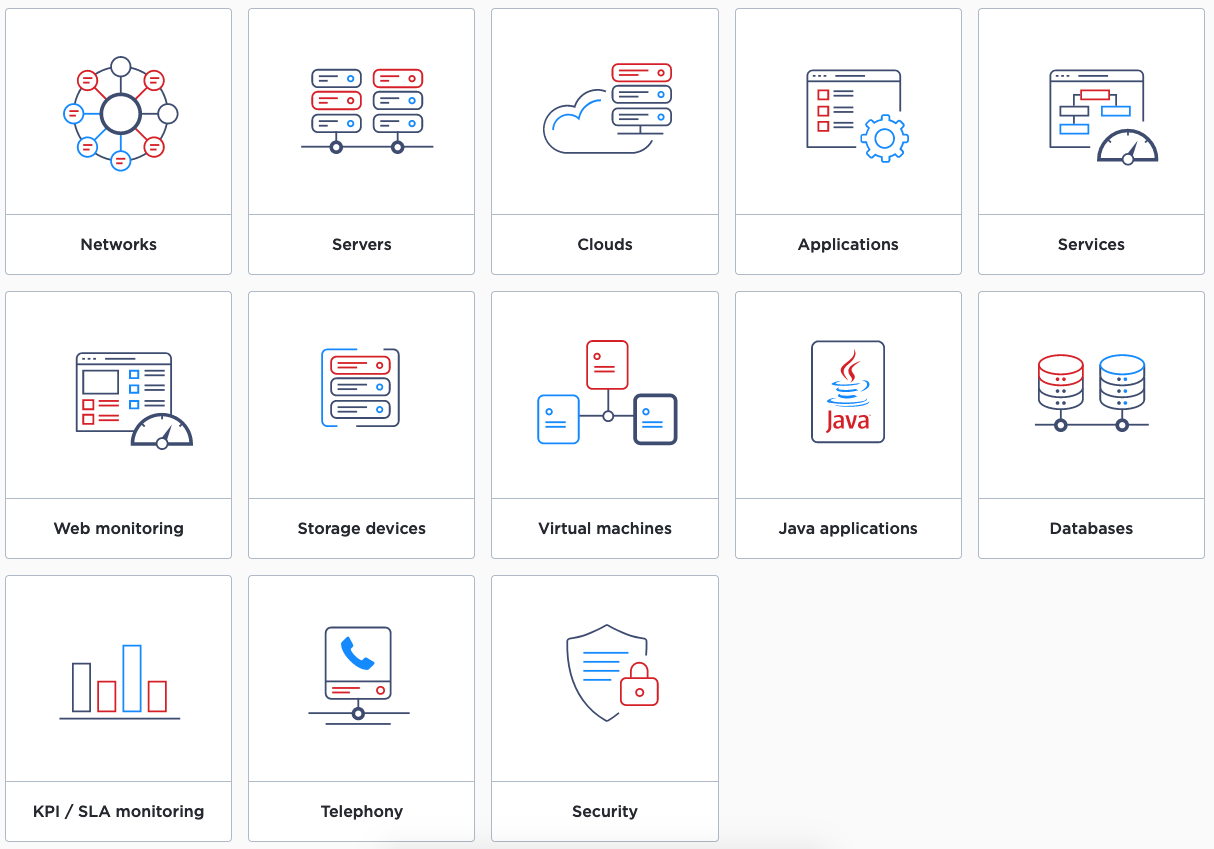
Monitor anything
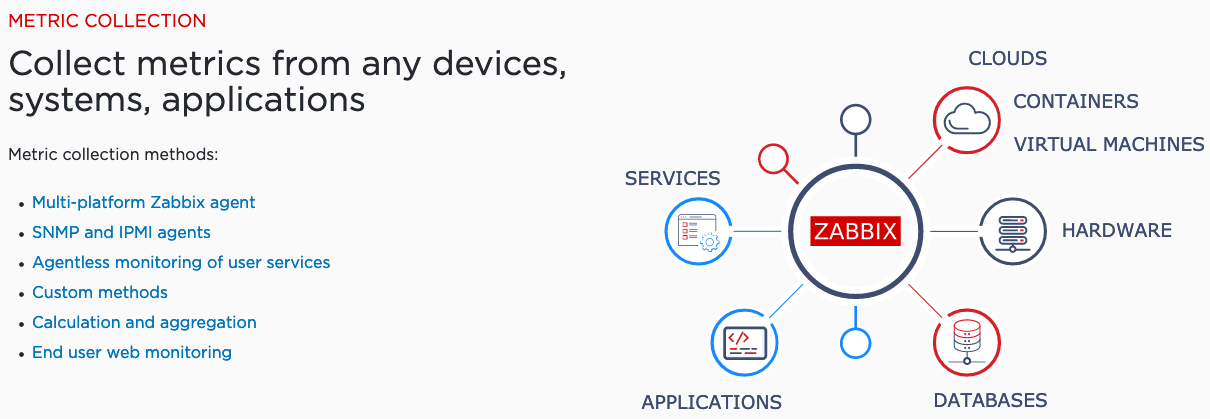
Solutions for any kind of IT infrastructure, services, applications, resources
Network | Server | Cloud | Application | Services | IoT
Monitor any possible performance metrics and incidents in your network:
![]()
Network performance
- Network bandwidth usage
- Packet loss rate
- Interface errorrate
- High CPU or memory utilization
- Number of tcp connections is anomaly high for this day of the week
- Aggregate throughput of core routers is low
![]()
Network health
- Link is down
- System status is in warning/critical state
- Device temperature is too high / too low
- Power supply is in critical state
- Free disk space is low
- Fan is in critical state
- No SNMP data collection
![]()
Configuration changes
- New device added or removed
- Network module is added, removed or replaced
- Firmware has been upgraded
- Device serial number has changed
- Interface has changed to lower speed or half-duplex mode
Monitor anything – Solutions for any kind of IT infrastructure, services, applications, resources
Monitor any possible server performance metrics and incidents:
![]()
Server performance
- High CPU or memory utilization
- Network bandwidth usage
- Packet loss rate
- Interface error rate
- Number of tcp connections is anomaly high for this day of the week
- Aggregate throughput of core routers is low
![]()
Server availability
- Free disk space is low
- System status is in warning/critical state
- Device temperature is too high / too low
- Power supply is in critical state
- Fan is in critical state
- No SNMP data collection
- Network connection is down
Configuration changes
- New components added or removed
- Network module is added, removed or replaced
- Firmware has been upgraded
- Device serial number has changed
- Interface has changed to lower speed or half-duplex mode